exchange/DefaultZero/threads= 1,batch= 256
|
|
Additional Statistics:
| Lower bound | Estimate | Upper bound | |
|---|---|---|---|
| Slope | 5.4742 us | 5.4779 us | 5.4817 us |
| R² | 0.9981794 | 0.9982418 | 0.9981757 |
| Mean | 5.5011 us | 5.5178 us | 5.5372 us |
| Std. Dev. | 55.825 ns | 92.490 ns | 122.55 ns |
| Median | 5.4815 us | 5.4882 us | 5.4949 us |
| MAD | 21.734 ns | 30.237 ns | 39.551 ns |


Understanding this report:
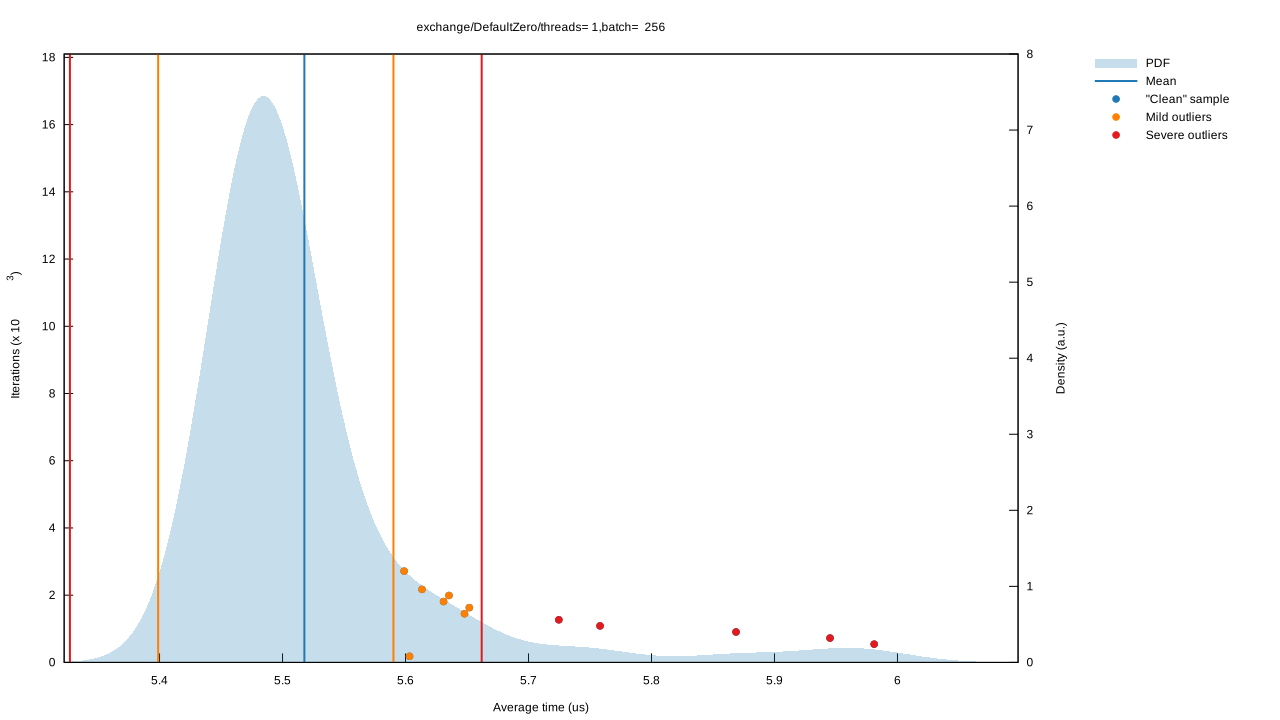
The plot on the left displays the average time per iteration for this benchmark. The shaded region shows the estimated probability of an iteration taking a certain amount of time, while the line shows the mean. Click on the plot for a larger view showing the outliers.
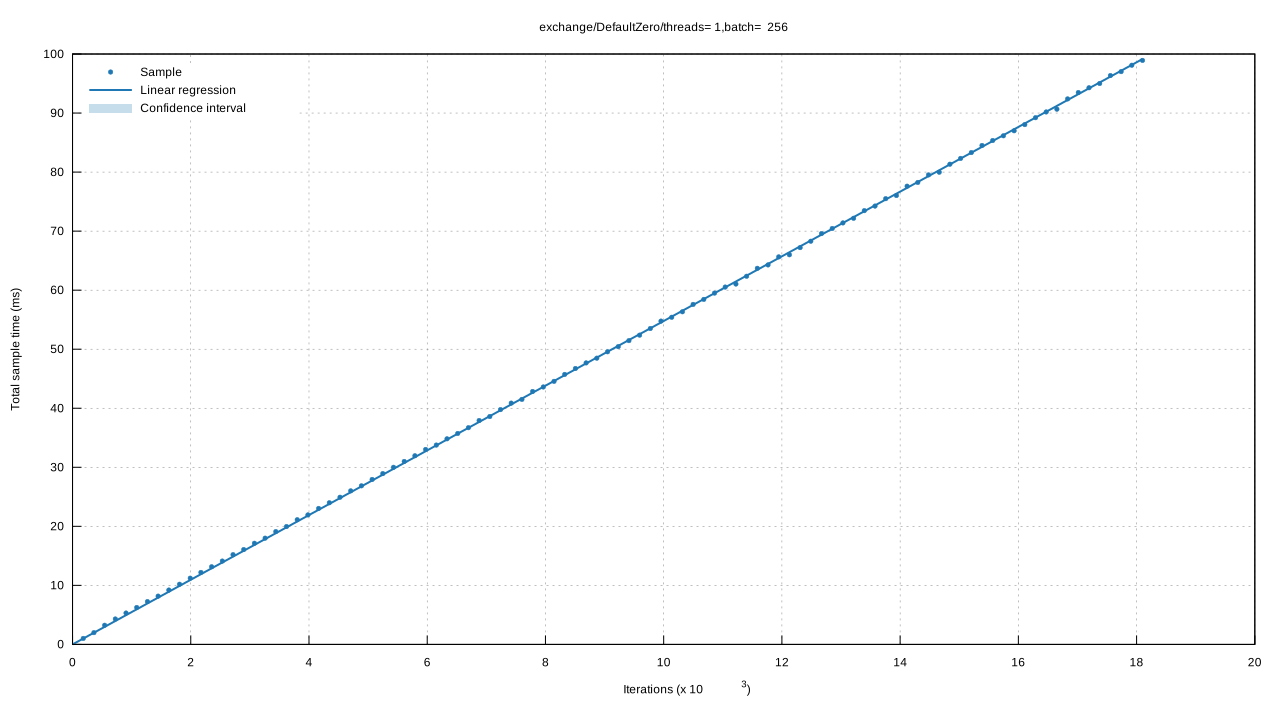
The plot on the right shows the linear regression calculated from the measurements. Each point represents a sample, though here it shows the total time for the sample rather than time per iteration. The line is the line of best fit for these measurements.
See the documentation for more details on the additional statistics.
Change Since Previous Benchmark

|

|
Additional Statistics:
| Lower bound | Estimate | Upper bound | ||
|---|---|---|---|---|
| Change in time | -3.1757% | -2.7515% | -2.3004% | (p = 0.00 < 0.05) |
Additional Plots:


Understanding this report:
The plot on the left shows the probability of the function taking a certain amount of time. The red curve represents the saved measurements from the last time this benchmark was run, while the blue curve shows the measurements from this run. The lines represent the mean time per iteration. Click on the plot for a larger view.
The plot on the right shows the two regressions. Again, the red line represents the previous measurement while the blue line shows the current measurement.
See the documentation for more details on the additional statistics.